Local Expenditure Budget Performance: Empirical Study On Regional Government of East Nusa Tenggara
Leopold Melkiano Triangga Dawu1,
Yustina Alphira Nay2
1.2Accounting Study Program, Faculty of Economics and Business, Widya Mandira Catholic University, Indonesia, correspondence:leopolddawu@gmail.com
Abstract
This study is able to measure the percentage of the contribution of budgeted regional expenditures and assess the suitability of the financial management of the NTT Provincial Government with the budget design legislation. The results of the analysis show that (a) Analysis of the Variance of Education Expenditure on average 80.85%, Health Expenditure an average of 70.23%, (b) Growth in Education Expenditure experienced an average positive growth in the moderate category of 30.10%. Average health spending experienced a positive growth in the low category of 20.74%. (c) The harmony of Education Expenditure and Health Expenditure shows that in 2016-2017 the regional government of the NTT Province has not been optimal in allocating the expenditure budget in accordance with the provisions of the Act. Whereas in 2018 the government has allocated optimally in accordance with the provisions of the Act, (d) the overall efficiency of Education Expenditure and Health Expenditure shows an average of below 100%, so the researcher concludes that the NTT Provincial Government in the absorption of the regional budget for the function of education and health has been efficient and economical but not yet effective. Local government performance is not in accordance with the concept of value for money.
Keywords: Budget Performance, Regional Expenditure, Education Function, Health Function
Introduction
Indications of the success of regional autonomy are reflected in the improvement of public services and welfare (Primanto et al., 2021; Cook et al., 2021; Salam, 2021; Irawan et al., 2021; Sutrisna & Utama, 2021; Garmer & McCarron, 2022) . In addition, it can be seen from the increasingly advanced democratic life, justice, equity, and the harmonious relationship between the central and regional governments as well as between regions. Budget reform demands an improvement by applying the concept of value for money or better known as 3E, namely economical, efficient, and effective (Jones and Pendlebury 1988 in Bastian 2010: 193). This has an impact on local governments (Pemda) being required to be better at finding and using inputs (funds) by always being guided by the 3Es. This encourages local governments to always try to pay attention to every rupiah obtained and used.
Changes in the budget system not only involve the budgeting process, but also the budget structure (Mahmudi, 2019:4; Bashtannyk et al., 2021; Tsindeliani et al., 2021; Lahn, 2021; Csehi, R., & Schulz, 2022). The budget structure was changed from the traditional budget structure with a balanced budget approach to a new budget structure, namely performance based budgeting. Performance-based budgeting emphasizes the achievement of results (outcomes) from programs and activities financed by the APBD, then linked to measurable performance targets (Mahmudi, 2019:4).
Since the granting of regional autonomy rights, local governments can determine their own Regional Revenue and Expenditure Budget (APBD) according to their needs and potential, so that the process of public services in an area can be illustrated through the allocated budget. Even regional spending is an important tool in stimulating the economy and regional progress. The education sector provides a very large contribution to the progress of a nation. Besides that, it is a vehicle for translating constitutional messages as well as a means of building the nation's character. An intelligent society will give the nuances of an intelligent life and will gradually form independence. Such individuals are a major investment in the development process in a country, both from the economic, political, social and cultural aspects.
The health sector is also an important part of measuring success and advancing a region. Health development is essentially an effort that must be carried out by all components of the Indonesian nation with the aim of increasing awareness, willingness, and ability to live a healthy life in order to realize the highest degree of public health, as an investment in the development of socially and economically productive human resources.
The achievement of the budget performance of the Regional Government of East Nusa Tenggara (NTT) can be seen from how well the level of efficiency and growth is generated. An illustration of the use of the NTT provincial budget can be seen in the following diagram:
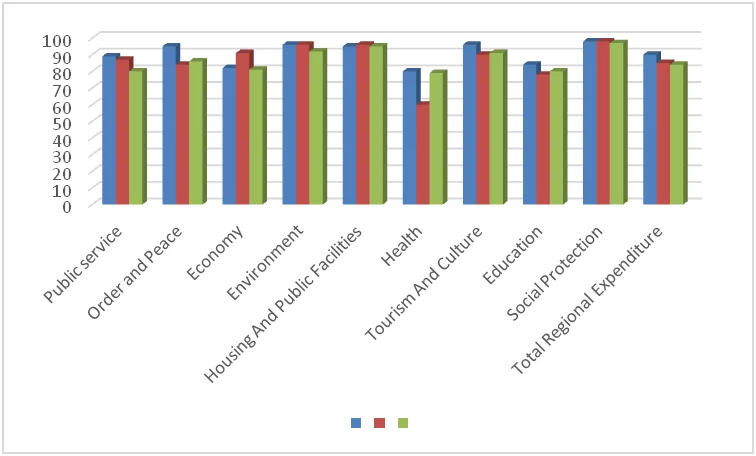
Figure 1.
Percentage of Realization of NTT Province Regional Budget by Function
2016-2018 Tahun
Source: Regional Finance Agency of NTT Province, 2020
The data in the diagram above shows a fluctuating phenomenon in the implementation of each expenditure for the 2016-2018 fiscal year. It is clear that the realization of the budget for all functions is still below 100%. Meanwhile, the education and health functions have the smallest average percentage, which is below 80% when compared to other functions. The visible phenomena indicate that the budgets for some programs or activities have not been absorbed and managed properly. This research is important because it is able to measure the percentage of the contribution of budgeted regional expenditures and to assess the suitability of the NTT Provincial Government's financial management with the budget design legislation.
LITERATURE REVIEW
Regional Revenue and Expenditure Budget (APBD)
The definition of APBD according to Abdul Halim (2009: 24) in his book Public Sector Accounting, Regional Financial Accounting: APBD is a regional government activity plan that is outlined in the form of numbers and shows the existence of a source of revenue which is the minimum target and the cost is the maximum limit for one budget period. . APBD is a regional budget that has the following elements:
- An area's activity plan, along with a detailed description.
- The existence of a source of revenue which is the minimum target to cover the costs associated with these activities, and the existence of costs which are the maximum limit of the expenditure carried out.
- Types of activities and projects expressed in numbers
- The budget period is usually 1 (one) year.
Functions of the Regional Revenue and Expenditure Budget (APBD)
According to Nurlan Darise (2008:133), the Government Budget is a formal document as a result of an agreement between the executive and the legislature regarding the expenditure set to carry out government activities and the expected income to cover the expenditure needs or the financing needed if a deficit or surplus is expected.
According to Law Number 17 of 2003 Article 1 point 8 concerning State Finances, it is stated that the Regional Revenue and Expenditure Budget, hereinafter referred to as APBD, is the regional government's annual financial plan approved by the Regional People's Representative Council.
Local Government Financial Performance
Permendagri No. 13 of 2006 states that performance is the output/result of activities/programs that will be or have been achieved in connection with the use of the budget with measurable quantity and quality.
According to Halim (2013: 231), financial performance analysis is an attempt to identify financial characteristics based on available financial reports. One of the tools used to assess the performance of local governments in managing regional finances as outlined in the APBD is financial ratio analysis.
Purpose of Financial Performance Measurement
According to Jumingan (2006:239) related to the measurement of Financial Performance contains several objectives:
- Knowing the success of the company's financial management, especially liquidity conditions, capital adequacy and profitability achieved in the current year and the previous year.
- Knowing the company's ability to utilize all assets owned in generating profits efficiently.
Benefits of Financial Performance Measurement
Wayne C. Parker (1996:3) in Arta Sadjiarto (2000:146) mentions five benefits of measuring Financial Performance, namely:
- Financial Performance Measurement improves the quality of taking
- Financial Performance Measurement improves internal accountability.
- Financial Performance Measurement improves public accountability.
- Financial Performance Measurement supports strategic planning and goal setting.
- Financial Performance Measurement enables an entity to determine resources effectively.
Understanding Budget
According to Mardiasmo (2002:61), the budget is a process carried out by public sector organizations to allocate their resources to unlimited needs (the process of allocating resources to unlimited demands).
Mardiasmo (2002:62) states that the public budget contains a plan of activity which is represented in the form of a plan for obtaining income and spending in one monetary unit.
Budget Function
Mardiasmo (2002:63) reveals that there are several main functions of the existence of a public sector budget, namely:
- Budget as a planning tool (Planning Tool)
- Budget as a control tool (Control Tool)
- Budget as a fiscal policy tool (Fiscal Tool)
- Budget as a political tool (Political Tool)
- Budget as a tool of coordination and communication (Coordination & Communication)
- Budget as a performance appraisal tool (Performeance Measurement Tool)
- Budget as a motivation tool (Motivation Tool)
Regional Shopping Concept
According to the Minister of Home Affairs Regulation Number 13 of 2006 concerning Guidelines for Regional Financial Management, Regional Expenditures are all expenditures from the regional general treasury account that reduce the equity of funds. Regional expenditure is a regional obligation in one fiscal year and will not be repaid by the region. Regional governments must allocate regional expenditures fairly and equitably so that they can be relatively enjoyed by all community groups without discrimination, especially in the provision of public services.
Expenditure by function is expenditure used for the purpose of alignment and integration of state/regional financial management which refers to Regulation of the Minister of Home Affairs Number 13 of 2006. Classification of Expenditures According to Government Regulation Number 71 of 2010, Expenditures are distinguished by type of expenditure, based on function and based on organization.
2.5 Framework for Thinking
- Regional Expenditure Variance Analysis
Education Function and Health Function (Mahmudi, 2010) = Realization: Budget
performance if 90% < R < 100%
Poor performance if 100% < R < 90%
- Analysis of Regional Expenditure Growth
Good performance = positive and keep improving
Poor performance = negative and declining
- Regional Expenditure Harmony Analysis
*Based on the 1945 Constitution and Law no. 20 / 2003à
Education budget allocation = 20% of APBD
*Based on Law No. 36 / 2009à
Health budget allocation = 10% of APBD
- Regional Expenditure Efficiency Analysis
Efficient if efficiency ratio < 100%
Inefficient if efficiency ratio > 100%
RESEARCH METHODS
Data analysis technique
TechniqueThe analysis used in this research is descriptive quantitative analysis based on the Budget Realization Report (LRA) to examine the concept of the budget, especially the analysis of expenditures based on function. Descriptive analysis is an activity to compile, classify, interpret and conclude data so as to provide an overview of the problems faced or studied. Financial analysis on the APBD is carried out by comparing several periods so that it can be seen how the trend is. The steps taken by the author are as follows:
- Identify the required financial report data at the Regional Finance Agency of East Nusa Tenggara Province.
- Calculating the data by using analysis of spending variance, analysis of spending growth, compatibility analysis of spending and spending efficiency ratios in order to know the increase in efficiency from each analysis, with the formula:
- Regional Expenditure Variance Analysis
- Regional Expenditure Growth Analysis
- Regional Expenditure Harmony Analysis (Expenditure Analysis by Function Against Total Expenditure)
- Regional Expenditure Efficiency Analysis.
- Interpret data that has been calculated using analysis to describe a problem that occurs in the object of research.
RESEARCH RESULTS AND DISCUSSION
]Province Regional Expenditure Performance Analysis 2016-2018
- Analysis of Expenditure Variance on Education and Health Functions.
Expenditure variance analysis is an analysis of the difference between the actual expenditure and the budget. The local government's financial performance is said to be good and efficient if there is a discrepancy (actual expenditure is less than the budgeted amount) but this needs to be studied more deeply to ensure that the discrepancy is caused by savings or because the program is not running, while it is said to be not good if there is an excess difference ( actual expenditure is more than the budgeted amount).
- Expenditure Variance Analysis of Education Function
From the Analysis of the Variance of Education Expenditure of the NTT Provincial Government during 2016-2018, it can be seen that the realization of spending did not exceed the budgeted expenditure. This is indicated by the average realization of regional budgets which only reached 79.71%. The highest realization occurred in 2016 at 84.11%, while the lowest realization occurred in 2017 at 78.45% and in 2018 at 80%. If the Regional Expenditure Variance Analysis there is an excess (the actual expenditure exceeds the budgeted amount) then it is said to have a poor Expenditure Financial Performance, whereas if there is a less difference (the actual expenditure is less than the budgeted amount) then the Expenditure Financial Performance is considered good (Mahmudi, 2010 ). So based on the Variance Analysis of Education Function Expenditures, it is known that in general the Financial Performance of Education Expenditures in NTT Province can be said to be good because there is a less difference. This is indicated by the absence of spending that exceeds the budget and the average realization of the budget from 2016-2018 is only 80.85% < 90%. This result contradicts the opinion expressed by (Mahmudi, 2010) that local governments are said to have good Expenditure Financial Performance if the expenditure realization does not exceed the target, but budget absorption that is too low below 90% is also considered unfavorable. Based on the analysis of variance, the difference in the lack of realization of education spending indicates a less than optimal performance where there may be programs that are not realized. This is indicated by the absence of spending that exceeds the budget and the average realization of the budget from 2016-2018 is only 80.85% < 90%. This result contradicts the opinion expressed by (Mahmudi, 2010) that local governments are said to have good Expenditure Financial Performance if the expenditure realization does not exceed the target, but budget absorption that is too low below 90% is also considered unfavorable. Based on the analysis of variance, the difference in the lack of realization of education spending indicates a less than optimal performance where there may be programs that are not realized. This is indicated by the absence of spending that exceeds the budget and the average realization of the budget from 2016-2018 is only 80.85% < 90%. This result contradicts the opinion expressed by (Mahmudi, 2010) that local governments are said to have good Expenditure Financial Performance if the expenditure realization does not exceed the target, but budget absorption that is too low below 90% is also considered unfavorable. Based on the analysis of variance, the difference in the lack of realization of education spending indicates a less than optimal performance where there may be programs that are not realized. This result contradicts the opinion expressed by (Mahmudi, 2010) that local governments are said to have good Expenditure Financial Performance if the expenditure realization does not exceed the target, but budget absorption that is too low below 90% is also considered unfavorable. Based on the analysis of variance, the difference in the lack of realization of education spending indicates a less than optimal performance where there may be programs that are not realized. This result contradicts the opinion expressed by (Mahmudi, 2010) that local governments are said to have good Expenditure Financial Performance if the expenditure realization does not exceed the target, but budget absorption that is too low below 90% is also considered unfavorable. Based on the analysis of variance, the difference in the lack of realization of education spending indicates a less than optimal performance where there may be programs that are not realized.
- Expenditure Variance Analysis of Health Function
Analysis of the Variance of Health Function Expenditures during 2016–2018 shows that none of the expenditure realizations exceeds the budget. This is indicated by the average percentage of health expenditure budget realization which only reached 68.67%. The highest realization occurred in 2016 at 80.05%, while the lowest realization occurred in 2017 at 51.63% and 79% in 2018.
Based on the analysis of variance with an average percentage of budget realization of 70.23% < 90% for 3 years, it indicates that the performance of the NTT Provincial Government has not been maximized. Budget absorption is one of the benchmarks in assessing government performance. This shows that spending in the health sector has not been properly realized to support the implementation of improving the quality of health.
- Regional Expenditure Growth Analysis
Growth analysis measures how much the local government's ability to maintain and increase success from period to period. This analysis is positive or negative, in the sense that it has been efficient or has not been absorbed in the use of the existing budget at the agency to finance all its activities.
- Analysis of Education Function Expenditure Growth in 2016-2018
Mahmudi, 2010
0% - 25% = low category growth
26% - 49% = medium category growth
50% - 100% = high category growth
Based on calculations, spending on education functions in 2016 grew by 7.52%, which shows the growth of spending in the low category. In 2017 there was a growth of 48.32% which shows the growth of spending in the moderate category. This is due to the transfer of authority for Senior High Schools (SMA), Vocational High Schools (SMK) and Special Schools (SLB) in all Regencies/Cities in NTT Province under the auspices of the Provincial Education Office. In 2018 expenditure on education functions experienced positive growth in the medium category, namely 34.47%. Overall, the average growth in expenditure on the education function of East Nusa Tenggara Province in 2016-2018 was 30.10%, positive growth in the medium category.
One indicator of the success of regional spending growth can be seen from the increase in the Human Development Index (IPM) (Yasinta, et al, 2018). However, the results of the analysis compared with the data in table 1 show the inequality between the ratio of growth in education spending which is only in the low and medium categories and the HDI of the Province of NTT which continues to increase.
Table 1.
Human Development Index (HDI)
NTT Province 2016-2018
|
Year |
2016 |
2017 |
2018 |
|
HDI |
63.13 |
63.73 |
64.39 |
Source: BPS NTT Province, 2020
The data above shows that the growth trend of local government education spending, although only reaching the moderate category, has quite a good impact in the region, as can be seen from the HDI of NTT Province from 2016-2018 which continues to increase.
- Analysis of Health Function Expenditure Growth in 2016-2018
Health function expenditure in 2016 experienced a negative growth in the low category of (12.21%). In 2017 experienced a positive growth in the low category of 18.50%. The year 2018 experienced positive growth in the high category, namely 55.93%. Although the percentage growth in health spending continued to increase from 2016-2018, the average growth in health function spending for the three years was positive in the low category of 20.74%. The impact of spending on health functions to the community can be seen from the data in the following bar chart. The data shows how health complaints occurred in NTT Province in 2016-2018.
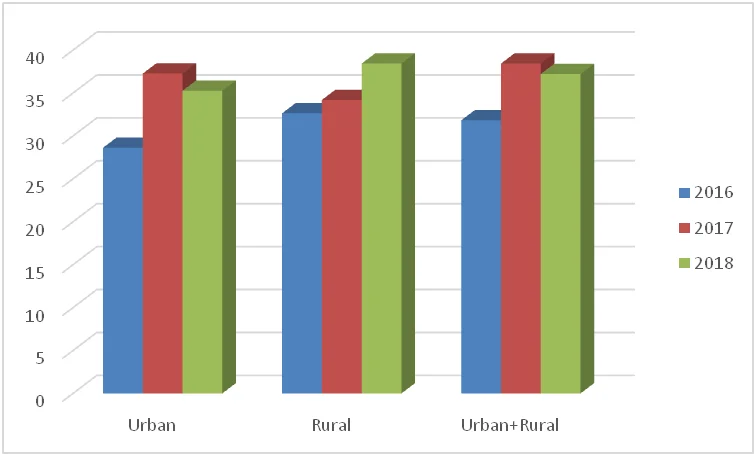
Figure 2.
Percentage of NTT Population Who Experienced Health Complaints During the Last Month by Region of Residence 2016-2018
Source: Susenas-BPS, 2020
The data above shows thatThe last percentage of NTT residents who have health complaints is 37.21% of the total NTT population or it can be said that three to four out of ten NTT residents experience health complaints. This percentage increased by 5.9% compared to 2016. There is a trend of increasing health complaints of the NTT population in the last three years. Thus, based on the data in figure two (2) and the analysis results show the performance/role of the NTT Provincial Government in health development efforts still needs to be optimized so that it has a good impact on public health services.
- Regional Expenditure Harmony Analysis.
Expenditure Analysis of Education and Health Functions on Total Expenditures.This information is to assess whether the local government has implemented the statutory provisions in allocating the budget.
- Based on the calculation results show that the 2016 health function budget allocation is 8.57%. In 2017, it was 8.23%. In 2018 it was 13.32%. When viewed from the provisionslaw no. 36 of 2009 the budget allocation for health functions should be 10% of the APBD, but this study proves that the NTT Provincial Government in 2016 and 2017 has not been optimal in allocating the expenditure budget in accordance with the provisions of the law, while in 2018 the budget allocation is in accordance with the regulations. the law is 13.32%. Overall, the budget allocation for health function expenditures from 2016-2018 shows an increase in accordance with statutory regulations.
- Feducation functionbudget allocation for 2016 was 3.78%. In 2017 it was 18.8%. The year 2018 is 23.48. When viewed from the provisionsAccording to the law, the education budget allocation should be 20% of the APBD, in accordance with the mandate of the 1945 Constitution Article 31 paragraph (4) and Law no. 20 of 2003 concerning the National Education System article 49 paragraph (1). This study proves that the Regional Government of East Nusa Tenggara Province in allocating the 2016 and 2017 budgets has not been optimal and in accordance with statutory provisions, while in 2018 the budget allocations have been in accordance with statutory regulations, namely 23.48%. Overall, the budget allocation for expenditure on education functions from 2016-2018 shows an increase in accordance with statutory regulations.
- Expenditure Efficiency Analysis of education function and health function.
The performance of the regional government is assessed from the Regional Expenditure Efficiency Analysis, it is said to have carried out budget efficiency if the efficiency ratio is less than 100%. Conversely, if more than 100% indicates a budget wastage (Mahmudi, 2010: 152). Based on the calculation of the Efficiency Analysis above, the education function expenditure in 2016 was 84.11%. In 2017 it was 78.01%, and in 2018 it was 80.45%. These results are in line with the opinion of Mahmudi (2010: 152) if the figure generated from the ratio is less than 100% then it is considered to have carried out budget efficiency.
Calculation of the Efficiency Analysis of health function spending in 2016 is 80.05%. In 2017 it was 51.64%, and in 2018 it was 79.36%. These results are in line with the opinion of Mahmudi (2010: 152) if the figure generated from the ratio is less than 100% then it is considered to have carried out budget efficiency.
Thus, the NTT Provincial Government has made efficient budgeting for the education and health functions.
Conclusion
The results of the four analytical tools show that the Regional Government of the Province of NTT in the absorption of the regional budget for the function of education and health has been quite efficient and economical but not yet effective so that the performance of the Regional Government of the Province of NTT is not in accordance with the concept of value for money.
Limitations and Suggestions
This research is limited to a quantitative approach, thus opening up opportunities for further researchers to use a qualitative approach to further examine the causes of the non-optimal budget absorption so that it becomes an input for improving the performance of the NTT Provincial Government in the future. In addition, further researchers can also examine the gap between the ratio of growth in the low category of expenditure and the HDI which continues to increase.
REFRENCES
- Abdul Halim. (2012). Akuntansi Sektor Publik, Akuntansi KeuanganDaerah. Salemba Empat: Jakarta.
- Bashtannyk, A., Akimova, L. M., Kveliashvili, I. M., Yevdokymov, V. O., Kotviakovskyi, Y. O., & Akimov, O. O. (2021). Legal bases and features of public administration in the budget sphere in Ukraine and foreign countries. Ad Alta: Journal of interdisciplinary research, (11 (1)), 63-68.
- Bastian, Indra. (2010). Akuntansi Sektor Publik Suatu Pengantar Edisi Ketiga. Erlangga: Jakarta
- Chrisman Youlli Karinda. (2013). Analisis Kinerja Anggaran Belanja pada BadanPengelola Keuangan dan Barang Milik Daerah.Provinsi Sulawesi Utara.
- Cook, L. J., Iarskaia-Smirnova, E., & Tarasenko, A. (2021). Outsourcing social services to NGOs in Russia: federal policy and regional responses. Post-Soviet Affairs, 37(2), 119-136.
- Csehi, R., & Schulz, D. F. (2022). The EU's New Economic Governance Framework and Budgetary Decision‐Making in the Member States: Boon or Bane for Throughput Legitimacy?. JCMS: Journal of Common Market Studies, 60(1), 118-135.
- Dewi Sartika. (2018). Analisis Kinerja Anggaran Belanja Pada Badan Perencanaan Pembangunan Daerah.Provinsi Sumatera Utara
- Dirjen Perimbangan Keuangan. (2014). Deskripsi dan Analisis APBD 2014. Artikel. Kementerian Keuangan Republik Indonesia
- Faud, Moh. Ramli. (2016). Analisis Laporan Keuangan Pemerintah Daerah. Ghalia Indonesia: Bogor
- Garner, P. W., & McCarron, G. P. (2022). Family child care providers’ perceptions of competence, autonomy, and relatedness: implications for well-being and professional growth. Community, Work & Family, 1-15.
- Hery. (2015). Analisis Laporan Keuangan Pendekatan Rasio Keuangan. CAPS: Yogyakarta.
- Irawan, B., Akbar, P., Purnomo, E. P., & Nurmandi, A. (2021). Development planning to accelerate Sustainable Development Goals (SDGs) in Mahakam Ulu Districts as a new autonomous region. Masyarakat, Kebudayaan dan Politik, 34(2), 184-195.
- Lahn, B. (2021). Changing climate change: The carbon budget and the modifying-work of the IPCC. Social studies of Science, 51(1), 3-27.
- Mahmudi. (2009). Manajemen Keuangan Daerah. Erlangga: Jakarta
- Mahmudi. (2010). Analisis Laporan Keuangan Pemerintah Darerah. UPP STIM YKPN: Yogyakarta
- Mahsun, Mohama. (2006). PengukuranKinerjaSektorPublik. BPFE: Yogyakarta.
- Mardsiamo. (2002). Otonomi dan Manajemen Keuangan Daerah. Penerbit ANDY: Yogyakarta.
- Peraturan pemerintah No 71 Tahun 2010 Tentang Klasifikasi Belanja.
- Peraturan Pemerintah Nomor 24 Tahun 2005 Tentang Standar Akuntansi Pemerintahan.
- Peraturan Pemerintah Nomor 58 Tahun 2005 Tentang Pengelolaan KeuanganDaerah.
- Permendagri No. 13 Tahun 2006 Tentang Pedoman Pengelolaan Keuangan Daerah.
- Primanto, A., Tanjung, A. M., Situmorang, M., Karim, A. M., Puspitasari, L., Purba, N., & Pramono, R. (2021). Inter-Regional Cooperation In Improving Welfare And Resolving Poverty In Indonesia. Academy of Strategic Management Journal, 20, 1-11.
- Sakina Nusarifa Tantri. 2017. Analisis Kinerja Anggaran Belanja Pada Dinas Kebudayaan Daerah Istimewa Yogyakarta Tahun 2012 – 2016.
- Salam, R. (2021). The Implementation of Good Governance with a View to Improving the Competence of State Civil Apparatus in the Regional Government. Budapest International Research and Critics Institute-Journal (BIRCI-Journal), 4(1), 1198-1206.
- Sugiyono. 2013.Metode Penelitian Pendidikan (Pendekatan Kuantitatif Kualitatif dan R&D). Alfabeta: Bandung.
- Sutrisna, I. W., & Utama, M. S. (2021). Good governance implementation and its effect on regional financial performance in bali province. South East Asia Journal of Contemporary Business, Economics and Law, 24, 33-39.
- Tsindeliani, I., Selyukov, A., Kikavets, V., Vershilo, T., Tregubova, E., Babayan, O., ... & Shorin, S. (2021). Transformation of the legal mechanism of taxation as a factor of influence on strategic planning of budgetary policy: Russia case study. Journal of Transnational Management, 26(3), 179-200.
- Undang-Undang No. 36 Tahun 2009 Tentang Kesehatan.
- Undang-Undang No. 20 tahun 2003 Tentang Sistem Pendidikan Nasional.
- Undang-Undang Nomor 1 Tahun 2004 Tentang Perbendaharaan Negara.
- Undang-Undang Nomor 17 Tahun 2003 Tentang belanja negara dalam APBN
- Undang-Undang Nomor 32 Tahun 2004 Tentang Pemerintah Daerah.
- Undang-Undang Nomor 33 Tahun 2004 Tentang Perimbangan Keuangan Antara Pemerintah Pusat dan Pemerintah Daerah.
